I. Background of the Experimental Study
Modal parameters—such as natural frequency, modal damping, and 3D mode shapes—are critical indicators for evaluating the dynamic mechanical performance of semiconductor packages and predicting vibration-induced fatigue failure.
Traditional piezoelectric accelerometers and single-point laser vibrometers suffer from significant limitations: they are restricted to discrete point measurements and cannot capture the full-field displacement or strain gradients of the chip. Furthermore, point-by-point scanning fails to capture the dynamic response across the entire field simultaneously, leading to data gaps and spatiotemporal asynchrony.
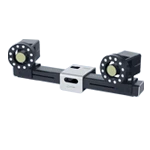
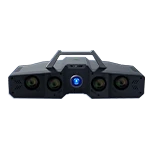
High-speed 3D Digital Image Correlation (3D-DIC) offers advantages such as non-contact measurement, full-field synchronous acquisition, and high spatiotemporal resolution, making it ideally suited for dynamic reliability testing of microelectronic packages. Equipped with modules for Operational Modal Analysis (OMA) and Operating Deflection Shape (ODS) analysis, and utilizing sub-pixel speckle matching combined with frequency-domain decomposition algorithms, the XTOP3D XTDIC-SPARK system can comprehensively extract 3D displacement, strain, and multi-order modal parameters under swept-sine and fixed-frequency resonance conditions. This provides quantitative, full-field experimental data to support package structural optimization and fatigue-resistant solder joint design.
II. Principles of High-Speed DIC Modal Testing Technology
Full-Field Displacement Reconstruction Algorithm
The system tracks temporal grayscale variations of an artificial speckle pattern on the chip surface and employs incremental, frame-by-frame DIC matching to calculate displacements at the sub-pixel, micron level. Synchronized external triggering of high-speed cameras ensures matching accuracy across the entire image sequence during high-frequency vibration, enabling continuous output of the full-field deformation evolution.
Binocular 3D Reconstruction
A dual high-speed camera setup establishes a binocular optical path, with intrinsic and extrinsic parameters calibrated using a standard dot-pattern target. Leveraging epipolar constraints and triangulation algorithms, the system simultaneously outputs 3D displacements—including in-plane (X/Y) and out-of-plane (Z) components—fully capturing complex combined deformations such as bending, warping, and shearing.
FDD-based Modal Parameter Extraction
The software performs Fast Fourier Transform (FFT) on the displacement time-history data from all measurement points to generate a frequency-domain power spectral density matrix. Using Frequency Domain Decomposition (FDD), it isolates the singular vectors corresponding to natural frequencies at various orders and automatically generates 3D mode shape maps, intuitively visualizing the chip's full-field vibration patterns at different resonant modes.
III. System Hardware and Software Configuration
Hardware Configuration
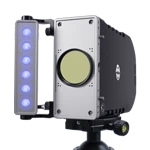
High-speed binocular imaging unit: High-frame-rate industrial cameras supporting wide-band swept-frequency acquisition (10–500 Hz);
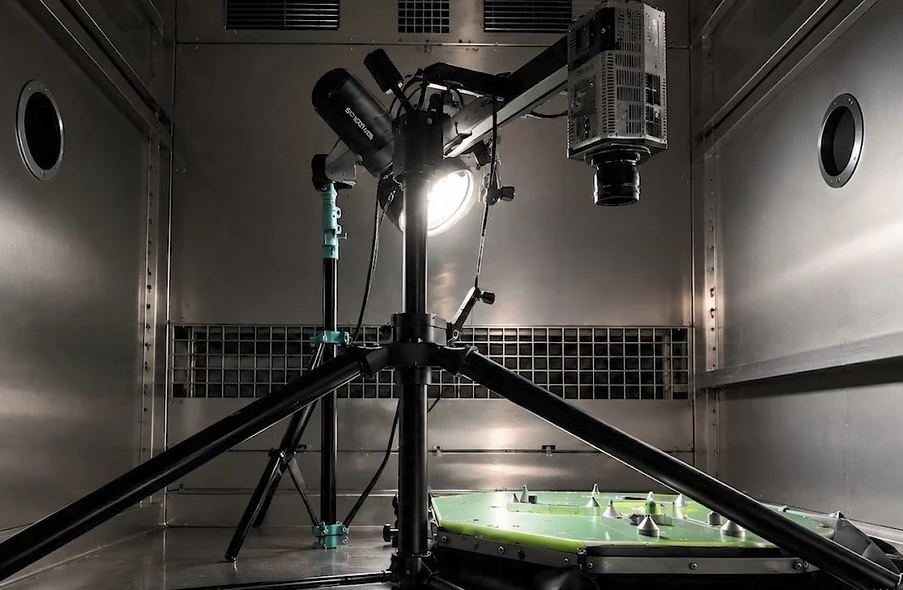
Optical components: 150mm macro lenses and polarized blue LED light sources to suppress chip reflections and eliminate motion blur;
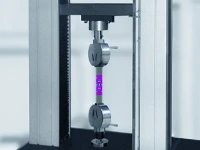
Auxiliary fixtures: High-precision dot calibration target and electromagnetic vibration test bench supporting sinusoidal sweep, fixed-frequency resonance, and random vibration excitation.
Core Software Functions
Integrated modal analysis module covering 3D speckle matching, full-field displacement/strain calculation, FFT spectrum analysis, OMA/ODS modal decomposition, ROI extraction, and time-history curve output.
IV. Case Study: Chip Resonance Mode Measurement via Swept-Sine and Fixed-Frequency Excitation
4.1 Test Conditions and Technical Challenges
This test was conducted as a standard validation project by a third-party electronic reliability laboratory, employing a combined testing protocol: initial identification via 10–500 Hz sinusoidal frequency sweeping, followed by steady-state resonance testing at a fixed frequency of 225 Hz.
Key Technical Challenges:
1. The chip package is minuscule, with resonance amplitudes in the micrometer range, demanding extremely high sub-pixel computational precision.
2. Significant stiffness disparities exist between the plastic encapsulation body, the substrate, and the solder joints, resulting in complex full-field deformation gradients that cannot be fully characterized by single-point sensors.
3. Broadband frequency sweeping generates massive volumes of time-series imagery, requiring high-frame-rate synchronous data acquisition and efficient, batch-processed frequency-domain analysis.
4.2 Test Implementation Workflow
Specimen Pre-treatment: A uniform, matte, random speckle pattern is applied to the chip surface to ensure continuous full-field image matching without data voids.
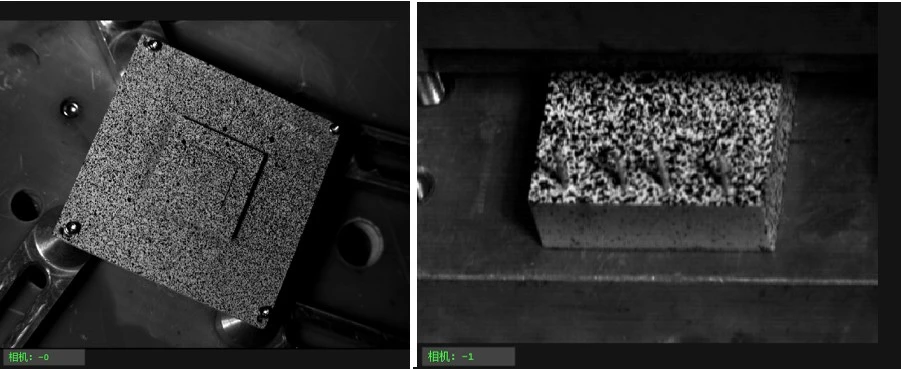
Creating a speckle pattern on the chip surface
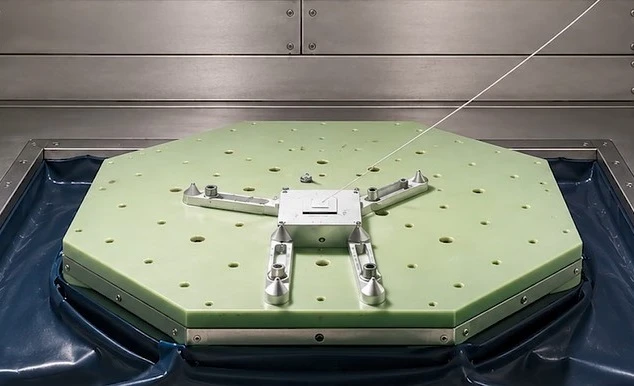
System Setup: The XTDIC-SPARK 3D high-speed measurement system was positioned above the vibration table and paired with macro blue-light illumination to eliminate reflections; a global calibration of the binocular system was then performed.
Vibration Excitation: A frequency sweep test was first conducted to identify the chip's natural frequencies across various modes; subsequently, steady-state vibration was applied at the first-order resonance frequency of 225 Hz, with high-speed synchronous acquisition of speckle images.
DIC Software Post-processing: Key Regions of Interest (ROIs)—such as the package body, corner solder joints, and substrate edges—were selected, and the OMA module was used to extract natural frequencies, damping ratios, and 3D mode shapes.
4.3 Test Results and Analysis
Full-field Z-axis out-of-plane displacement distribution
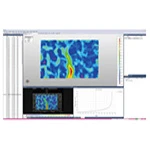
The 3D displacement contour map at the 225 Hz first-order resonance frequency reveals that the Z-axis amplitudes at the chip's four corners are significantly higher than those in the central plastic encapsulation area. These corners are zones of cyclic alternating stress concentration; prolonged vibration in these areas is prone to causing solder ball cracking and plastic encapsulation delamination.
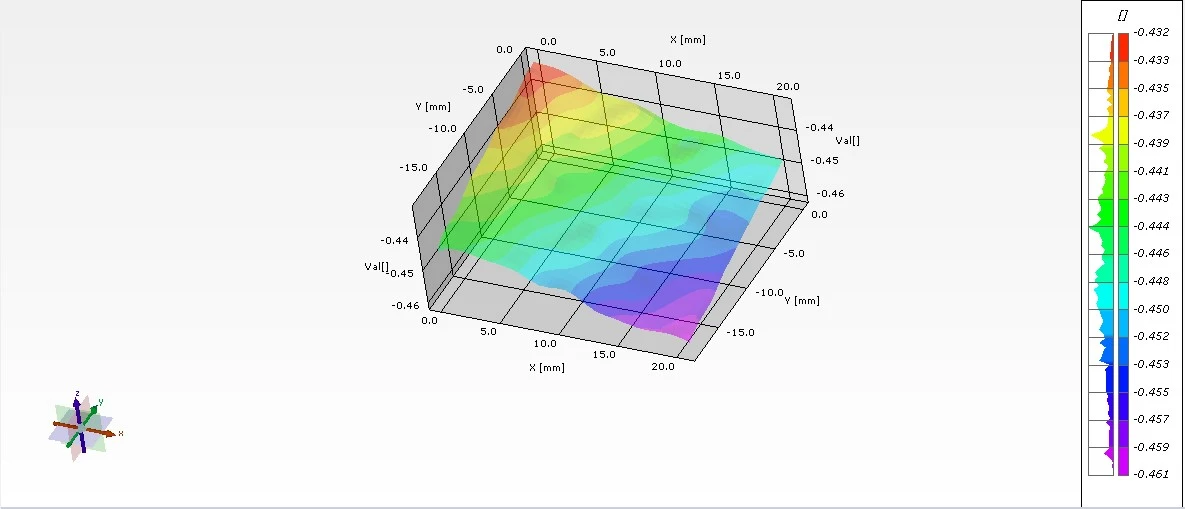
Contour plot of Z-direction displacement at 225 Hz resonance (1)
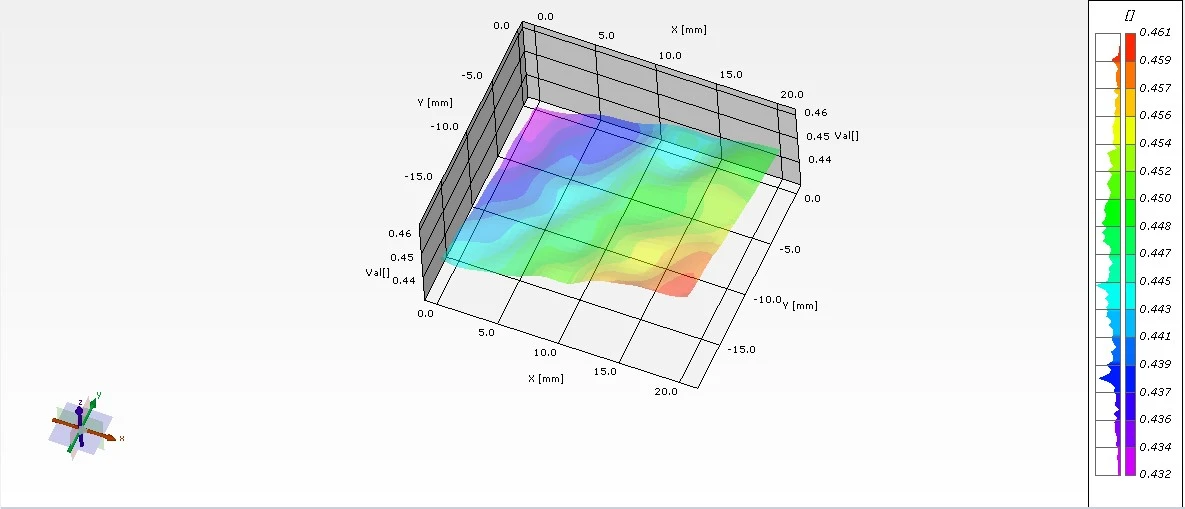
Z-axis displacement contour plot at 225 Hz resonance (2)
Time-history vibration curves at characteristic measurement points
Z-axis acceleration and displacement time-history curves are extracted from high-amplitude regions at the corners and edges; this allows for the quantitative determination of peak resonant amplitudes and the fluctuation patterns of alternating strain, thereby quantifying the cyclic fatigue loads on the solder joints.
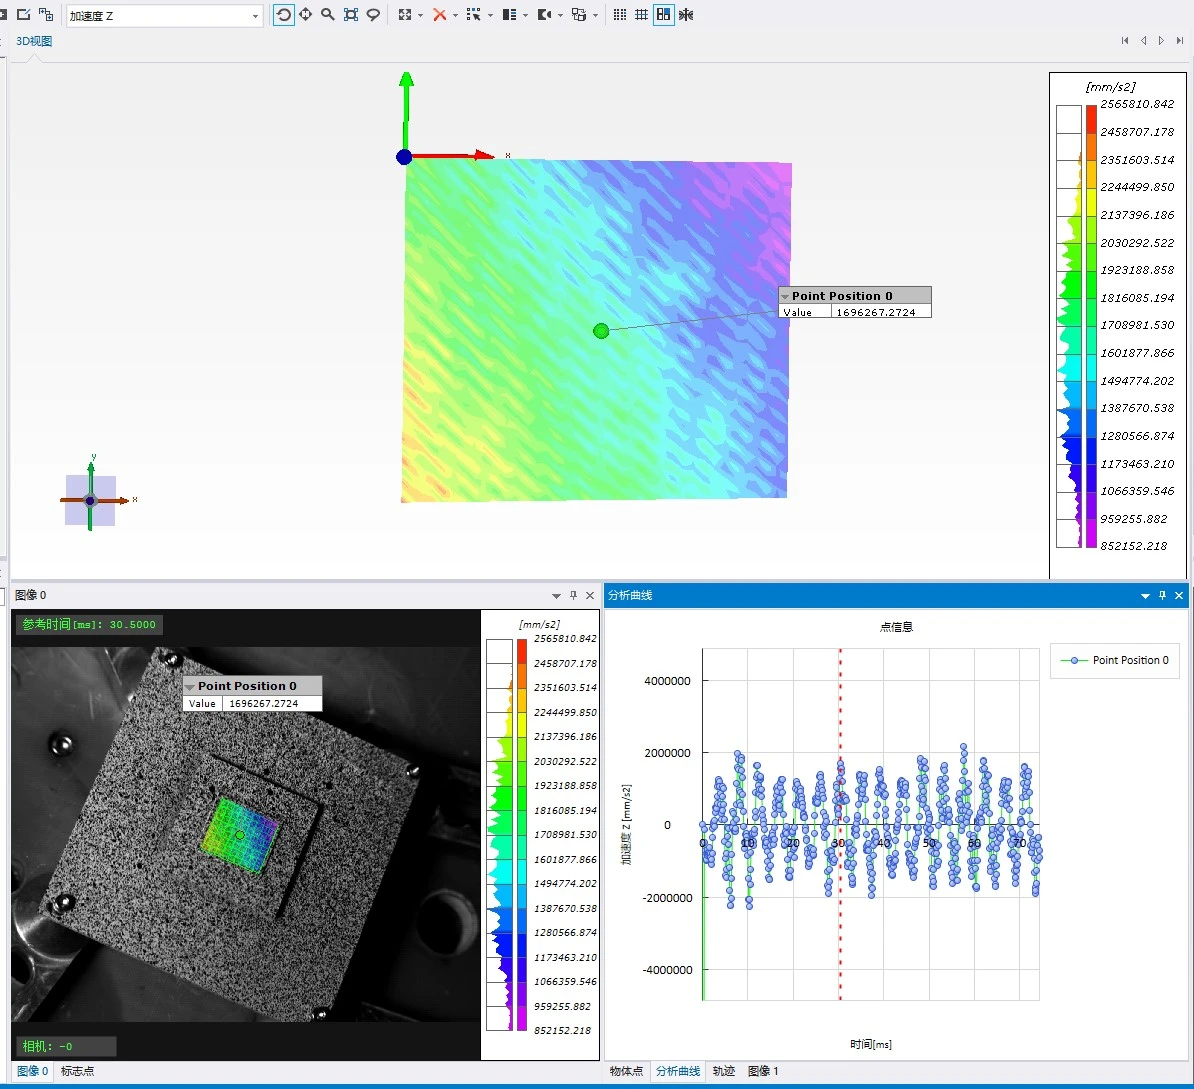
Z-axis displacement due to acceleration
Differentiation of Multi-Order Modal Shapes
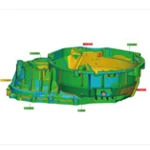
Based on full-field data from frequency sweeps, the DIC software automatically calculates the chip's first three natural frequencies and their corresponding mode shapes: the first order involves overall central bending; the second, diagonal twisting; and the third, localized edge warping.
Unlike traditional single-point vibration measurement, which yields only discrete data points, high-speed 3D-DIC technology outputs a continuous, full-field mode shape map in a single acquisition, precisely pinpointing the structural weak points susceptible to failure at each resonant mode.
Engineering Guidance Value
Visualization of full-field modal data clearly identifies chip corner solder joints as high-risk zones for vibration fatigue. Leveraging measured natural frequencies and mode shapes, engineers can optimize PCB support layouts, encapsulant moduli, and solder ball array configurations—as well as avoid operating frequency ranges—to prevent resonance-induced failures at the source.
V. Summary of Engineering Application Value
The XTDIC-SPARK 3D high-speed measurement system integrates high-speed imaging, sub-pixel deformation analysis, and frequency-domain modal analysis. It overcomes the inherent limitations of traditional contact-based and single-point vibration measurement methods, enabling non-contact, full-field, and synchronous measurement of modal parameters with high spatiotemporal resolution.
Case studies utilizing standard sinusoidal sweep and fixed-frequency resonance vibration tests have validated the stability of XTOP3D high-speed DIC technology under high-frequency and wide-bandwidth conditions. Full-field modal testing allows for the precise identification of vibration fatigue weak points in chips and solder joints and the quantification of displacement and strain distribution patterns across different resonant modes. This guides the iterative optimization of packaging and PCB structures, shortens semiconductor product development cycles, and provides comprehensive quantitative experimental data for assessing chip vibration reliability and analyzing resonance failure mechanisms.