As sustainable development garners increasing attention, the demand for electric vehicles (EVs) continues to rise. Lithium-ion batteries are a core component of EVs; beyond serving as the power source, they play a pivotal role in enabling advanced connectivity and autonomous driving capabilities.
Thanks to advantages such as electrical insulation, ease of processing, and lightweight properties, plastics have become the material of choice for structural components in battery modules. They are used to manufacture battery modules, housing components, cell holders, and crash-cushioning devices. Testing their tensile and stretch-forming performance helps ensure superior crash and crush protection for battery assemblies.
I. Measurement Requirements
Sheet metal forming is a crucial material processing technology widely applied in the automotive, aerospace, and shipbuilding industries. The forming limit of sheet metal is a key indicator of its plastic formability. By measuring the degree of deformation a material can withstand under hydraulic bulging or combined stretch-bulging, a technical foundation and practical criteria are established for evaluating formability and optimizing forming processes.
II. Conventional Testing Methods
Existing Solutions
There are typically three methods for determining the Forming Limit Diagram (FLD): theoretical calculation, numerical simulation, and experimental measurement. Traditional experimental methods rely on the principle that a circular pattern on the sheet deforms into an ellipse; industrial flexible rulers or toolmaker's microscopes are used to measure the major and minor axes of the ellipse, thereby approximating the maximum and minimum principal strains in that specific area.
Limitations of Existing Solutions
-
Theoretical calculations often yield results that diverge from experimental data due to the limited applicability of specific criteria.
-
The accuracy of numerical simulation results is heavily dependent on the operator's experience.
-
Experimental determination of FLDs has historically been challenging; limitations in existing strain measurement tools and equipment made it difficult to accurately capture the limit deformation occurring just prior to instability.
III. XTOP3D FLC Measurement Solution
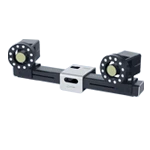
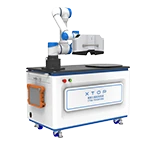
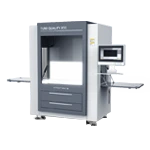
To overcome the limitations of traditional methods, a full-field, dynamic measurement technique based on Digital Image Correlation (DIC) has been introduced for sheet metal forming limit strains. XTOP3D’s independently developed XTDIC-FLC 3D Sheet Metal Forming Limit Measurement System tracks and matches grayscale information from images captured before and after deformation to measure the instantaneous full-field displacement and strain of thin-walled components under bulging loads. This system offers numerous advantages, including non-contact measurement, high precision, a simple optical setup, minimal environmental sensitivity, and a high degree of automation.
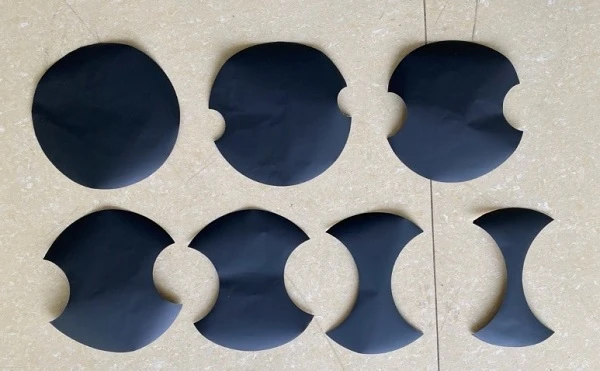
Cutting thin-walled components into FLC specimens
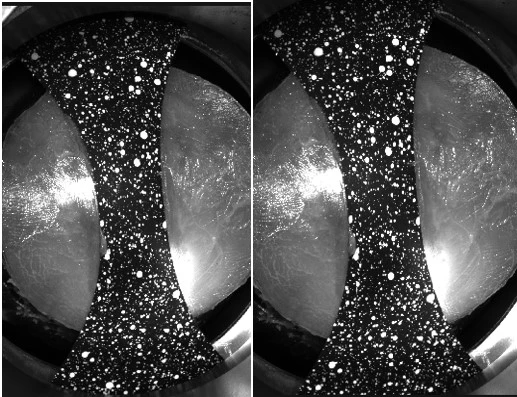
By combining Digital Image Correlation (DIC) and binocular stereo-vision technology—and utilizing a specialized experimental setup for measuring sheet metal forming limits—it is possible to measure limiting strains under large deformations to construct the material's Forming Limit Diagram (FLD); this approach offers significant advantages over traditional methods.
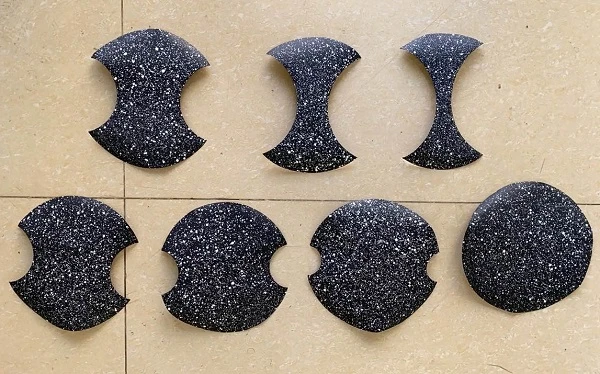
FLC specimen after speckle patterning
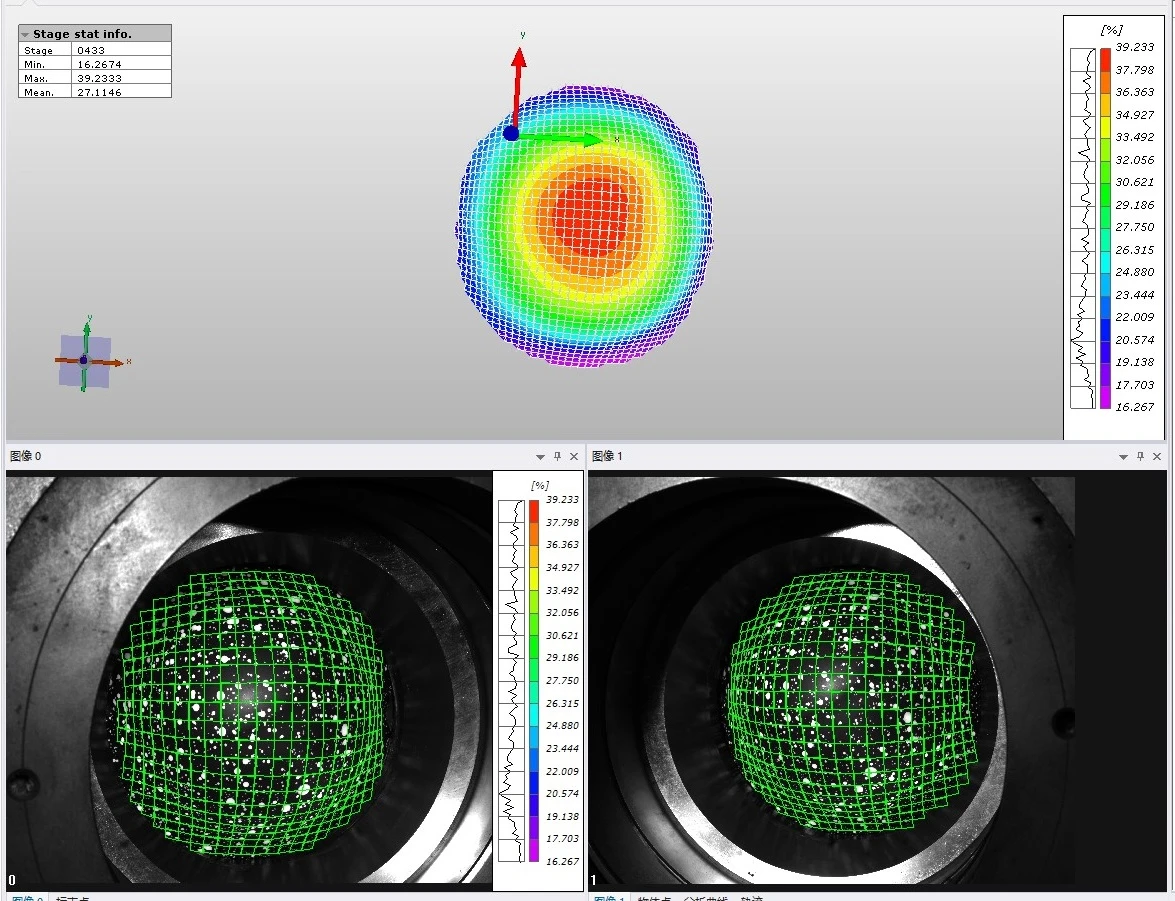
Loading was applied using a sheet metal forming testing machine, while the Forming Limit Curve (FLC) was determined using the XTDIC-FLC dynamic strain measurement method by capturing strain data either prior to or after specimen fracture. The procedure for the cupping test and data acquisition is described below:

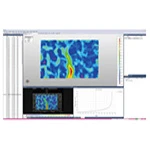
By utilizing the XTDIC-FLC system for sheet metal forming limit testing, a wealth of data can be obtained; a single test run yields results such as fracture limit curves, limit curves for various strain states, and full-field strain data for both the exterior and interior of the sheet. This approach delivers high-precision full-field measurements and accurate material data, ensuring test results that closely reflect actual production conditions.
Fitting the FLC Curve
Each set of cross-section data comprises two components: major strain and minor strain. Quadratic curve fitting is performed on each component to determine its extremum (the maximum for major strain and the minimum for minor strain). These two extrema serve as the X and Y coordinates for a single point on the FLC plot. By processing multiple sets of cross-section data, a series of points is generated; fitting these points yields the data for the FLC curve.
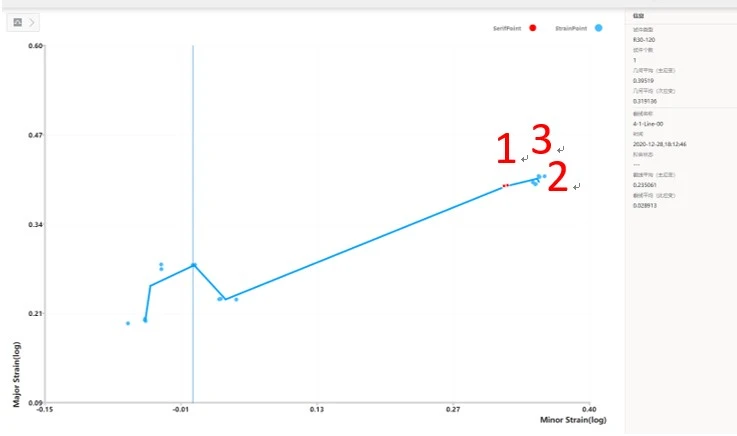
FLC fitting results
|
Test specimen
|
Ultimate principal strain
|
Secondary strain
|
|
Specimen No. 5
|
0.39
|
0.31
|
|
Specimen No. 6
|
0.40
|
0.35
|
|
Specimen No. 7
|
0.40
|
0.35
|
By combining sheet metal forming limit strain measurement methods with specialized testing equipment, the testing of thin-walled specimens can be completed rapidly. The use of the XTDIC-FLC system (from Xintuo 3D) enables not only the measurement of strain in the final formed state but also the rapid, intuitive measurement of surface strain distribution throughout the entire forming process.
Future trends for module housing plastics point toward lightweighting and design integration, necessitating materials that offer superior mechanical properties and excellent processability for thin-walled components. As these plastics are complex polymer blends, it is essential to evaluate mechanical properties—such as rigidity, impact resistance, and dimensional stability—to ensure optimal molding performance. This approach meets the operational requirements for new energy vehicle battery components and provides a practical solution for customers seeking to reduce battery weight.