Sheet metal forming is a material processing technology widely applied in industries such as aviation, aerospace, shipbuilding, and automotive manufacturing. The forming limit of sheet metal is a key indicator for assessing its plastic formability.
The Forming Limit Diagram (FLD)—constructed using limiting strains—is commonly used to characterize the extent of deformation a sheet can undergo during stretching, bulging, or combined stretch-bulging operations. It provides both a technical foundation and practical criteria for evaluating formability and optimizing forming processes.
Definition of FLC/FLD
Sheet Metal Forming Limit (FLC/FLD)
The maximum point on the engineering stress-strain curve corresponds to the material's tensile strength (σb). The strain at maximum load represents a form of stable elongation in a tensile test specimen; since sheet metal forming and localized necking determine the material's forming limit, this stable elongation serves as a crucial measure of the material's ductility.
During the deformation of sheet metal—such as under the force applied by a cupping test machine—thinning occurs in a specific region. The sheet ruptures once the maximum strain limit is reached, and the state immediately preceding this rupture defines the material's forming limit.
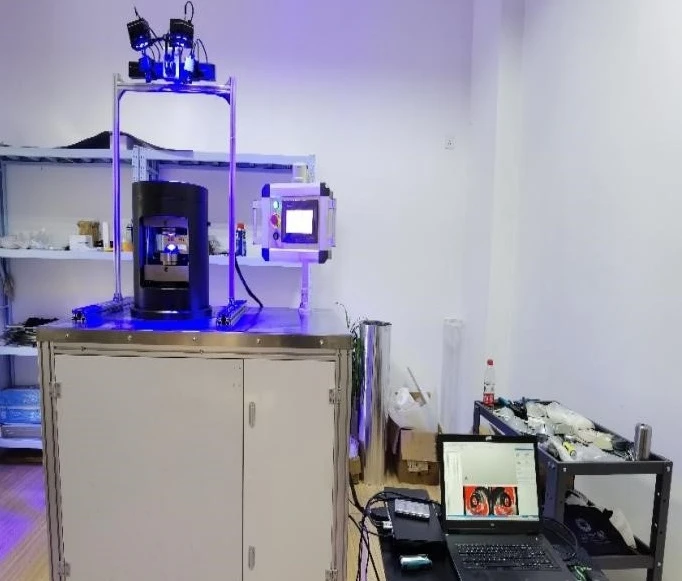
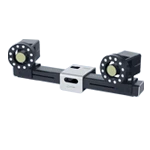
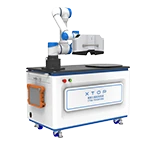
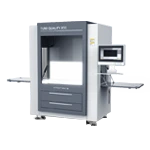
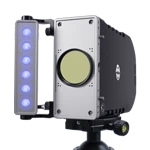
XTOP3D XTDIC-FLC Sheet Metal Forming Limit Measurement System
Measurement of Sheet Metal Forming Limits
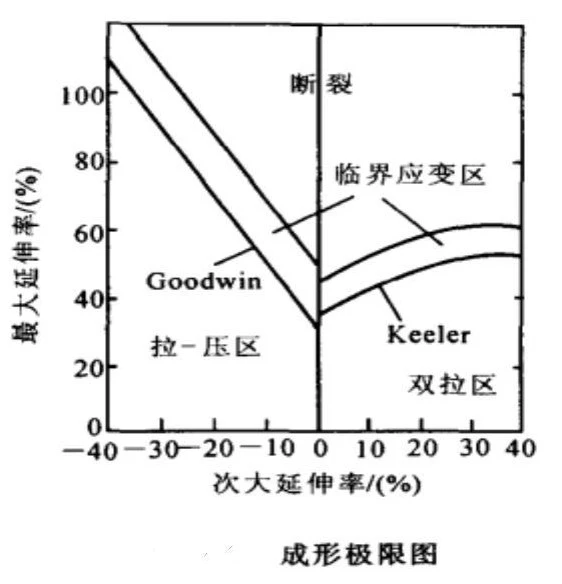
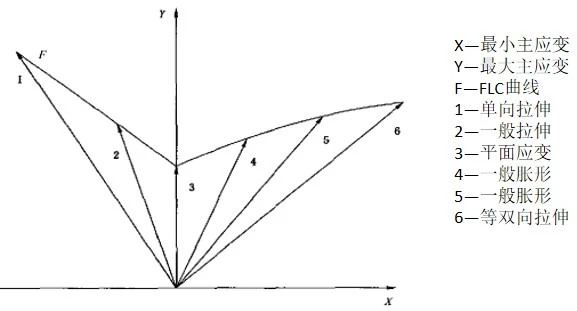
Forming Limit Diagram (FLD): A chart plotting major strain versus minor strain points.
The FLD makes it possible to distinguish whether a specific strain value represents a safe state or a failure state for a given material; the boundary separating safe points from failure points is defined as the Forming Limit Curve (FLC).
The FLC establishes an acceptable strain limit. In sheet metal forming, if the major strain (ε1) and minor strain (ε2) exceed the limits defined by the combination of these two strains, the sheet metal will undergo thinning and fracture.
Forming Limit Diagram
Forming Limit Diagram (FLD)
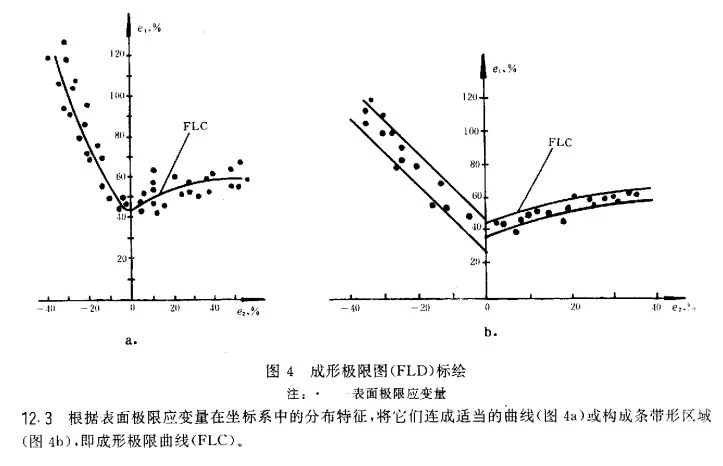
A surface strain coordinate system is established by plotting the minimum principal strain (e₂ or ε₂) on the horizontal axis and the maximum principal strain (e₁ or ε₁) on the vertical axis, using limiting strain values derived from the surface.
Rapid Determination of Sheet Metal Forming Limit Curves (FLC) Using DIC
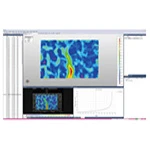
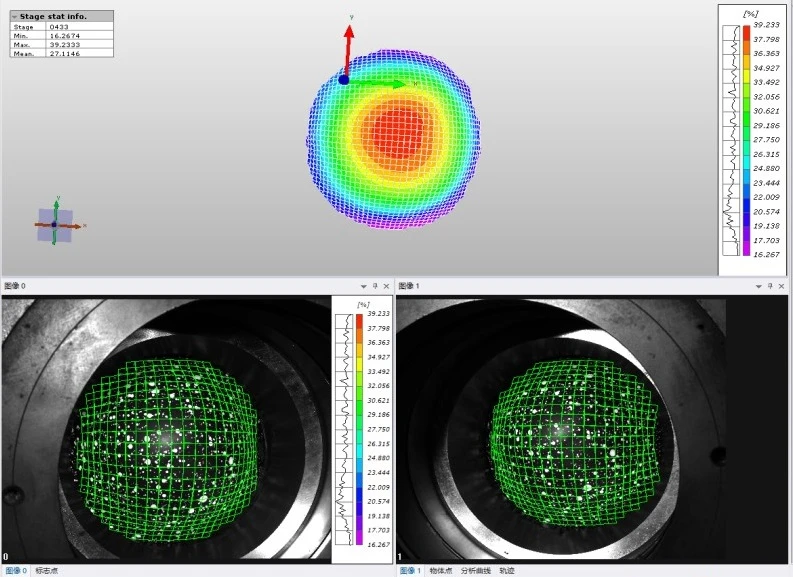
The XTDIC-FLC sheet metal forming limit measurement system utilizes Digital Image Correlation (DIC) technology in conjunction with sheet metal forming and cupping testing machines. By applying a random speckle pattern to the specimen and capturing a sequence of video images showing sheet deformation during the cupping test, the system directly determines limiting strain values—employing techniques such as grid strain analysis and DIC measurement—to generate the Forming Limit Curve (FLC), construct the Forming Limit Diagram (FLD), and output the results.
FLC Testing Procedure
Overview of the Experimental Principle
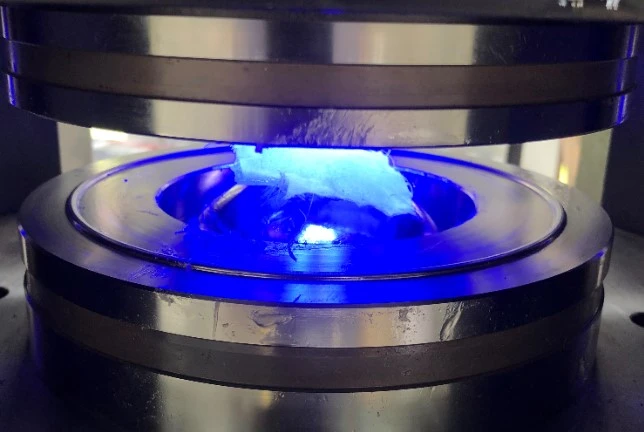
To accurately determine the FLC, a speckle pattern is printed onto the surface of a flat, undeformed metal sheet. The sheet is then deformed to the point of fracture using the Nakajima forming method with a hemispherical punch. The XTDIC-FLC sheet metal forming limit measurement system captures images, and DIC software is used to calculate strain data.
A cross-sectional measurement method (position-dependent measurement) is employed to output limit strain point data, and the FLC curve is calculated using DIC software algorithms.
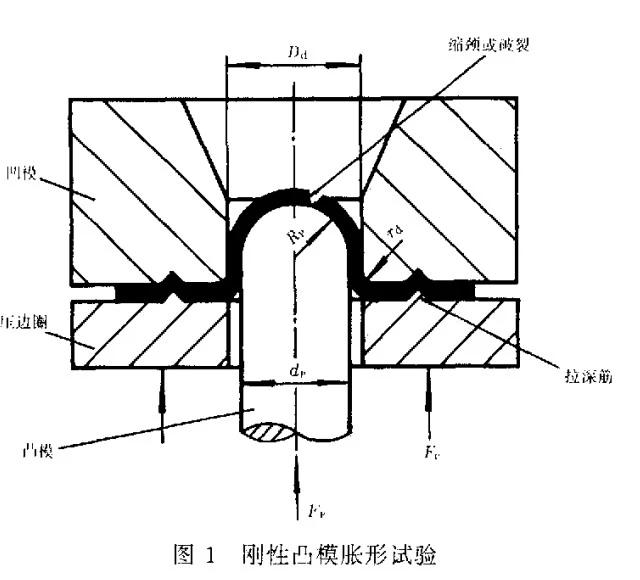
Rigid punch bulging test
Experimental Description:
Forming limit curves are typically determined under laboratory conditions using the rigid punch bulging method; tensile tests and hydraulic bulging tests may be used as supplementary methods when necessary.
In the rigid punch bulging test, a specimen with a grid pattern marked on one surface is placed between the die and the blank holder. A blank holding force is applied to clamp the material outside the draw bead area. Under the action of the punch force, the central part of the specimen undergoes bulging deformation to form a dome, causing distortion in the grid circles or speckle patterns on its surface. The test is halted when localized necking or fracture occurs on the dome; the permissible local surface limiting principal strains for the sheet metal are then calculated from these results.
Surface limiting principal strains corresponding to various strain paths are obtained by varying the lubrication conditions at the contact interface between the specimen and the punch, as well as by using specimens of different widths. A greater variety of lubrication conditions and specimen widths yields a more reliable forming limit diagram.
Forming Limit Distribution
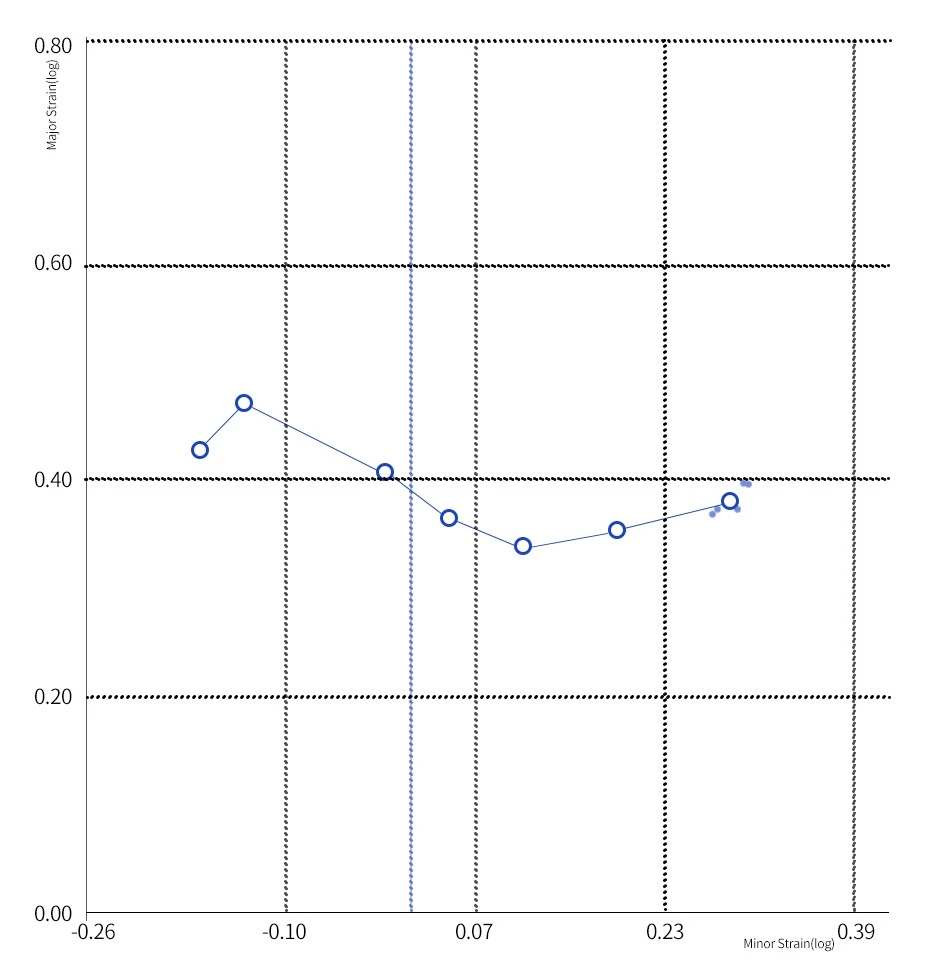
Forming limits are determined by measuring the major and minor principal strains, covering a strain path range from uniaxial tension to biaxial tension. The forming limit curve is constructed by connecting individual data points collected under various strain states. In the resulting plot, the x-axis represents the minor principal strain, and the y-axis represents the major principal strain, as shown in the figure below:
Experimental Procedure – Hardware Assembly
1. Determine the measurement distance using a pre-prepared fixture, and adjust the camera angle and lens focal length of the XTDIC-FLC sheet metal forming limit measurement system.
2. Mount the measuring head of the XTDIC-FLC system onto the testing machine and adjust its angle.
3. Rotate the measuring head to an unobstructed area and perform calibration, ensuring the correct calibration distance based on the focused ranging method.
4. Upon completion of calibration, slowly rotate the cantilever mechanism to the test area; the setup for the XTDIC-FLC sheet metal forming limit measurement system is now complete.
Experimental Procedure – Starting the Test
1. Power on the testing machine and separate the upper and lower assemblies to facilitate operation.
2. Apply lubricant or place a lubricating silicone sheet on the spherical punch; then, insert the sheet metal specimen and operate the machine to clamp it securely.
3. Configure the testing machine parameters and initiate the test in conjunction with the DIC system.
4. The test may be stopped when a crack is visually detected or when the load on the testing machine drops.
Precautions:
Regarding image acquisition for the XTDIC-FLC sheet metal forming limit measurement system, the acquisition rate of the DIC cameras during the final stage prior to stamping fracture must be at least 10 frames per second.
Experimental Procedure – DIC Software Analysis
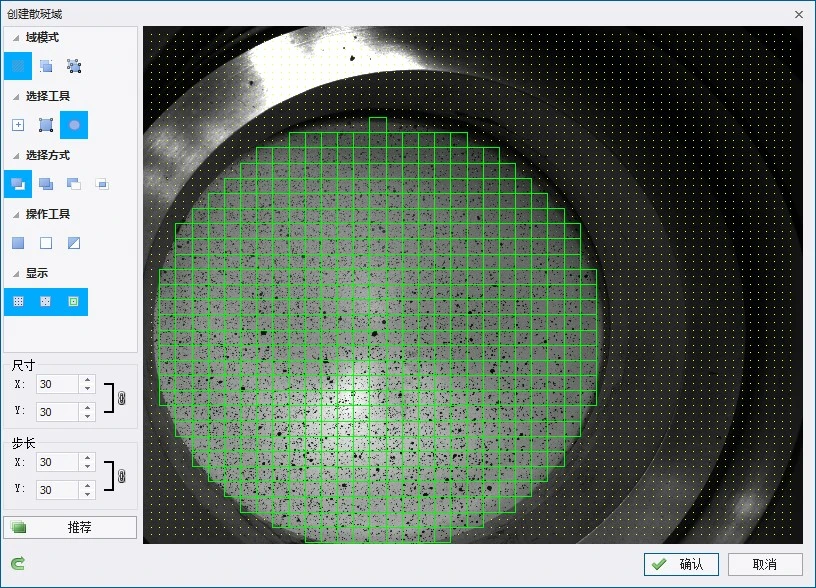
Defining the Speckle Region
When defining the speckle region in the DIC software, the entire area under test must be included within the region's boundaries. During the DIC experiment, images of the entire surface of the stamped sheet metal must be captured to facilitate comprehensive analysis.
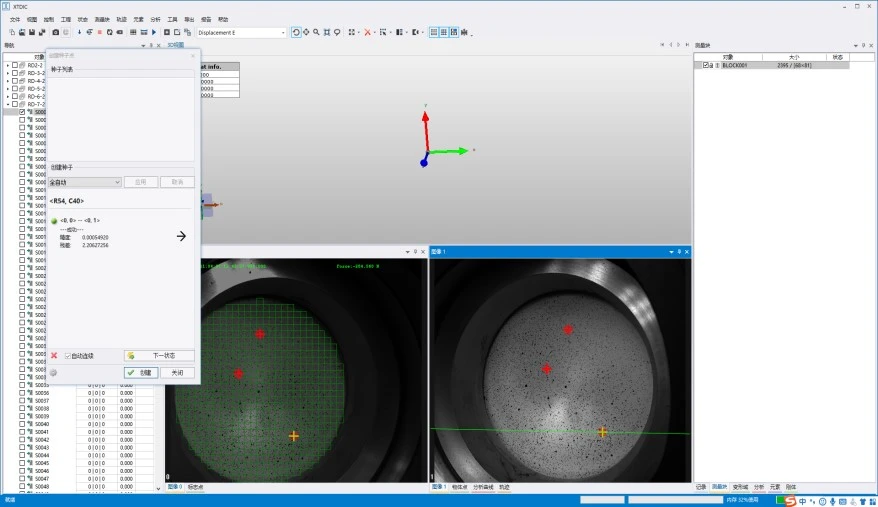
Seed Point Matching
When creating seed points, it is necessary to place them in the upper, middle, and lower regions respectively. Since the cup-bulge specimen will eventually fracture, creating only a single seed point would make matching difficult in other regions during the later stages of calculation; using multiple seed points ensures that surface patches are present across all these regions.
Experimental Procedure – Software Analysis
Creating and Exporting Section Lines
1. Locate a photograph of the cupping test specimen—captured by the XTDIC-FLC sheet metal forming limit measurement system—taken just prior to fracture.
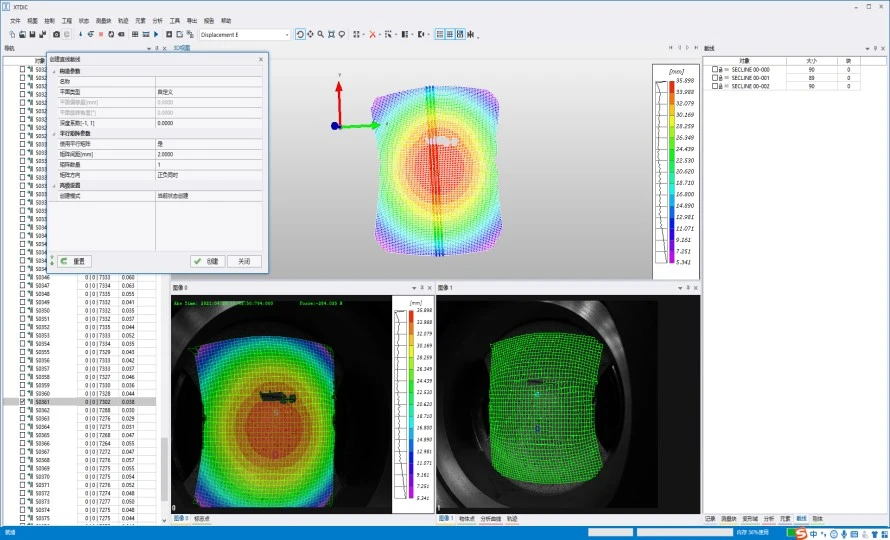
2. In the DIC software interface, navigate to Analysis > Section Line> FLC Creation; ensure the orientation of the created section lines is perpendicular to the direction of the crack on the cupping specimen.
3. Select the "Create at Current State" mode (this corresponds to the position-dependent method) and click Create to generate three section lines.
4. Select the three section lines and click Export FLC Data.
Experimental Procedure – Software Analysis
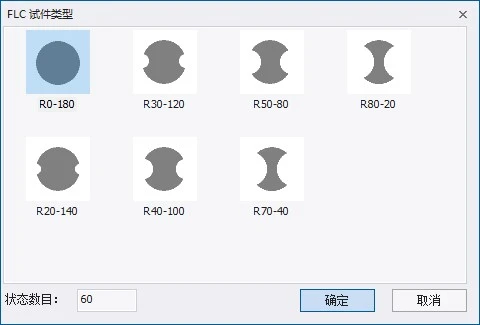
When outputting cross-section data, select the appropriate specimen type based on the current shape of the cupping test specimen, and then save the boundary data.
Experimental Procedure – Generating the FLC Curve
Click "Add Section Line," select the save folder, and import the section line data. Click "Calculate" to generate the FLC curve.