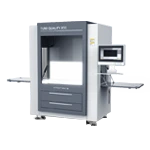
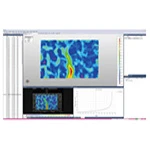
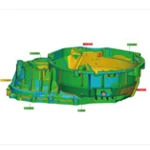
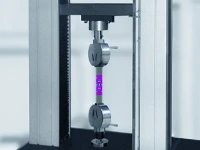
This case study demonstrates how the XTDIC 3D full-field strain measurement system replaces traditional strain gauges to capture multiaxial strain and micro-cracks in metal welded joints during 0.5Hz torsion fatigue testing.
I. Background
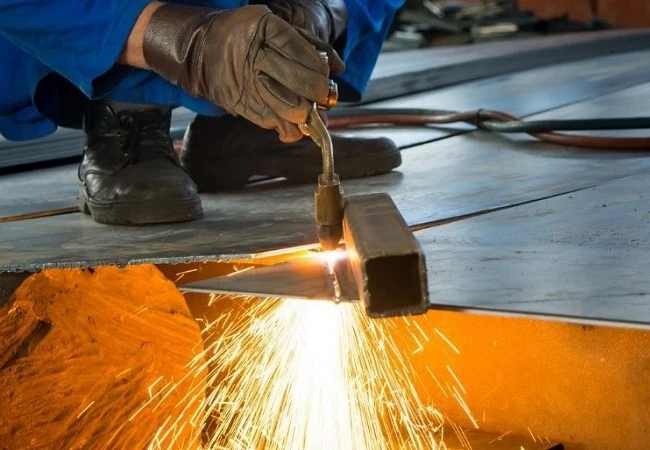
Welded joints represent typical weak points in engineering structures—such as steel building frameworks and bridges—subjected to cyclic loading. Statistics indicate that over 70% of failures in welded structures stem from fatigue damage (e.g., weld crack propagation).
In practical construction engineering, welded metal joints are frequently subjected to complex multiaxial stresses (arising from dynamic loads such as earthquakes and wind-induced vibrations). However, the multiaxial strain distribution characteristics within the weld zone under coupled tension-torsion loading remain unknown, creating an urgent need for high-precision, full-field deformation measurement techniques for verification.
II. DIC Principles, Technical Comparison, and Significance
The XTDIC 3D full-field strain measurement system was employed to conduct torsional fatigue testing on welded specimens. By monitoring full-field dynamic strain, the fatigue damage and crack propagation within the weld zone under torsional loading were observed, enabling further analysis of the specimens' fatigue characteristics. Its advantages lie in its non-contact nature, high spatiotemporal resolution, and potential for coupled multi-physics analysis.
|
Comparison item
|
Technical Solution
|
Conventional strain gauge solution
|
|
Measurement method
|
Non-contact measurement, suitable for various complex operating conditions.
|
Under torsional operating conditions, contact sensors are prone to detachment, resulting in low data reliability.
|
|
Data dimensions
|
Full-field strain (spatially continuous distribution)
|
Discrete point measurement (single-point/multi-channel)
|
|
Multi-axis strain decoupling
|
Simultaneously output components such as axial, shear, and principal
|
Multiple sets of strain gauges need to be installed, making it impossible to ensure synchronization.
|
|
Crack detection sensitivity
|
It can identify strain concentration zones corresponding to micron-scale micro-cracks.
|
Relies on abrupt changes in resistance and lags behind actual crack propagation.
|
|
Correlation analysis of thermal
|
Synchronous temperature field-strain field mapping
|
Cannot be directly linked to thermo-mechanical coupling effects.
|
Application of DIC Technology in Cyclic Loading Fatigue
(1) Dynamic Strain Monitoring
• High-frequency response: Compatible with cameras of varying acquisition frequencies to capture rapidly changing strain fields during cyclic loading (e.g., sudden strain changes during crack propagation).
• Synchronization control: Integrated with the testing machine to achieve precise synchronization between the loading phase and image acquisition.
(2) Fatigue Damage Identification
• Early-stage damage detection: Identifies micro-crack initiation (e.g., localized strain concentration zones) based on strain field non-uniformity.
• Crack propagation tracking: Measures crack length, width, and propagation direction in real-time, and calculates the crack propagation rate.
(3) Fatigue Life Prediction
• Full-field strain data: Combined with finite element (FE) models or fatigue damage models to predict the fatigue life and load-bearing life of materials and specimens.
• Multi-scale analysis: Correlates macroscopic strain distribution with microscopic damage mechanisms.
III. DIC System Components and Key Specifications
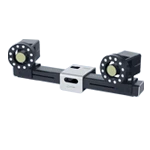
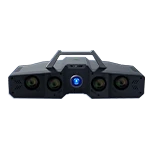
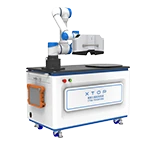
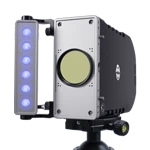
DIC measurement system: Includes cameras, light sources, calibration panels and fixtures, speckle patterning kits, and software.
|
DIC measurement system
|
Technical Specifications and Functional Design
|
Suitability Analysis
|
|
XTDIC-5M Binocular System
|
2448×2048 resolution, 75Hz frame rate, equipped with a 100mm lens
|
Covers a 50 mm field of view; single-pixel resolution ≈ 20 μm.
|
|
Infrared camera coupling system
|
Simultaneous acquisition of temperature fields and 3D coordinate fields (thermo-mechanical coupling analysis)
|
Monitoring the effect of fatigue-induced temperature rise on local strain
|
|
Blue LED lighting
|
Low-heat interference light source, adapted to speckle reflection characteristics.
|
Enhance speckle contrast and suppress ambient light interference.
|
|
Phase-shift triggered acquisition
|
Matches the 0.5 Hz fatigue cycle and precisely synchronizes image acquisition with the peak load moments.
|
Eliminate motion blur and improve displacement calculation accuracy.
|
Under combined tension-torsion fatigue loading, Digital Image Correlation (DIC) technology is used to monitor the evolution of axial and shear strain distributions in the weld and ground regions in real time, thereby quantifying the progression of fatigue damage.
IV. Test Procedure: Torsional Fatigue Testing of I-Shaped Welded Specimens
Subject of study: Welded metal specimen (I-shaped quasi-cylindrical structure; total dimensions: 120 mm × 60 mm; weld and ground region: approx. 50 mm × 50 mm).
Loading frequency: Torsional fatigue test conducted over more than 8,500 cycles; the XTDIC 3D full-field strain measurement system utilized a 0.5 Hz frequency for fatigue cycle analysis and data acquisition.
Data Processing and Analysis
A TTL signal output from the fatigue testing machine controller triggered the DIC system to acquire data at 0.5 Hz intervals. The DIC system continuously recorded full-field data throughout the 8,500 cycles, and images from key stages were extracted for analysis.
Based on specific requirements, various strain types and displacement data were analyzed to evaluate the changes in the specimen at different stages of the fatigue test.
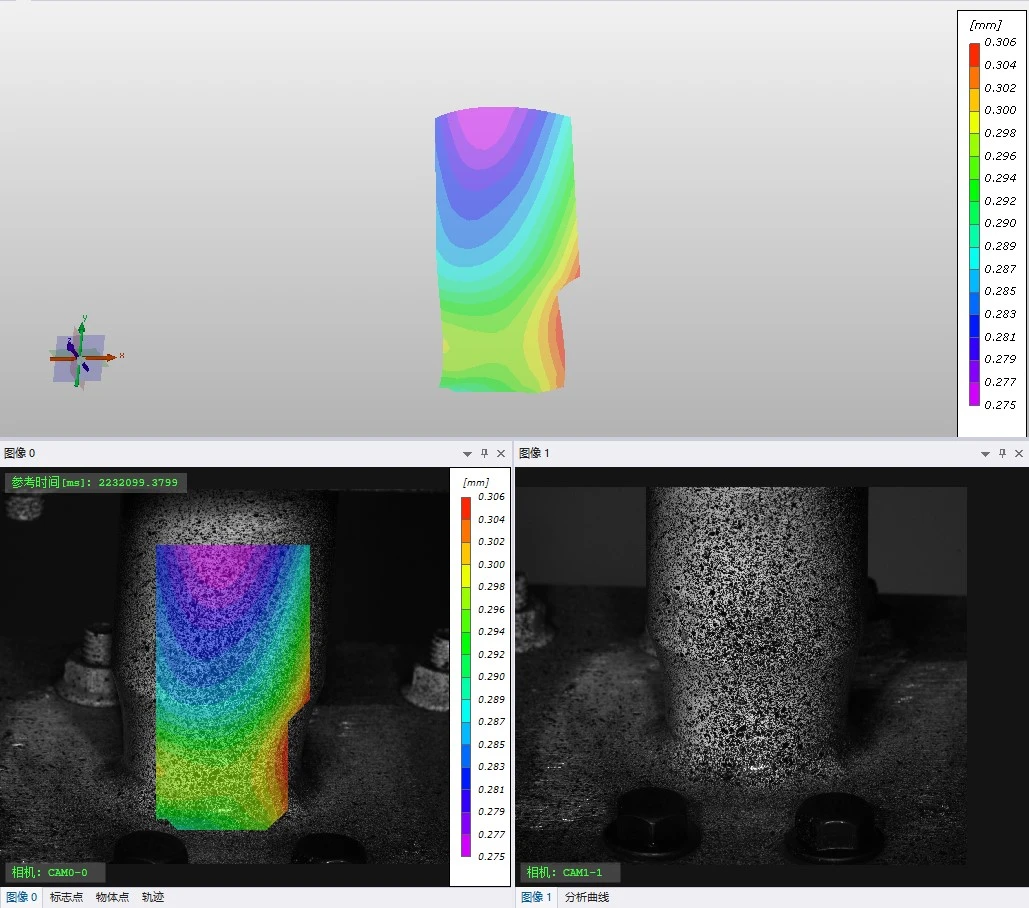
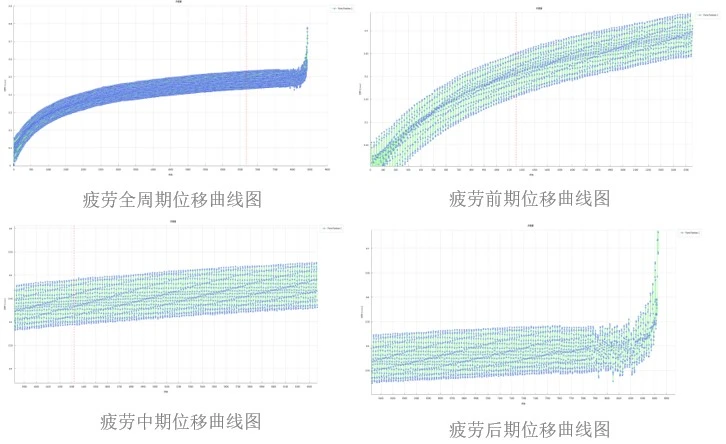
Displacement cloud diagram of welded cylindrical specimen
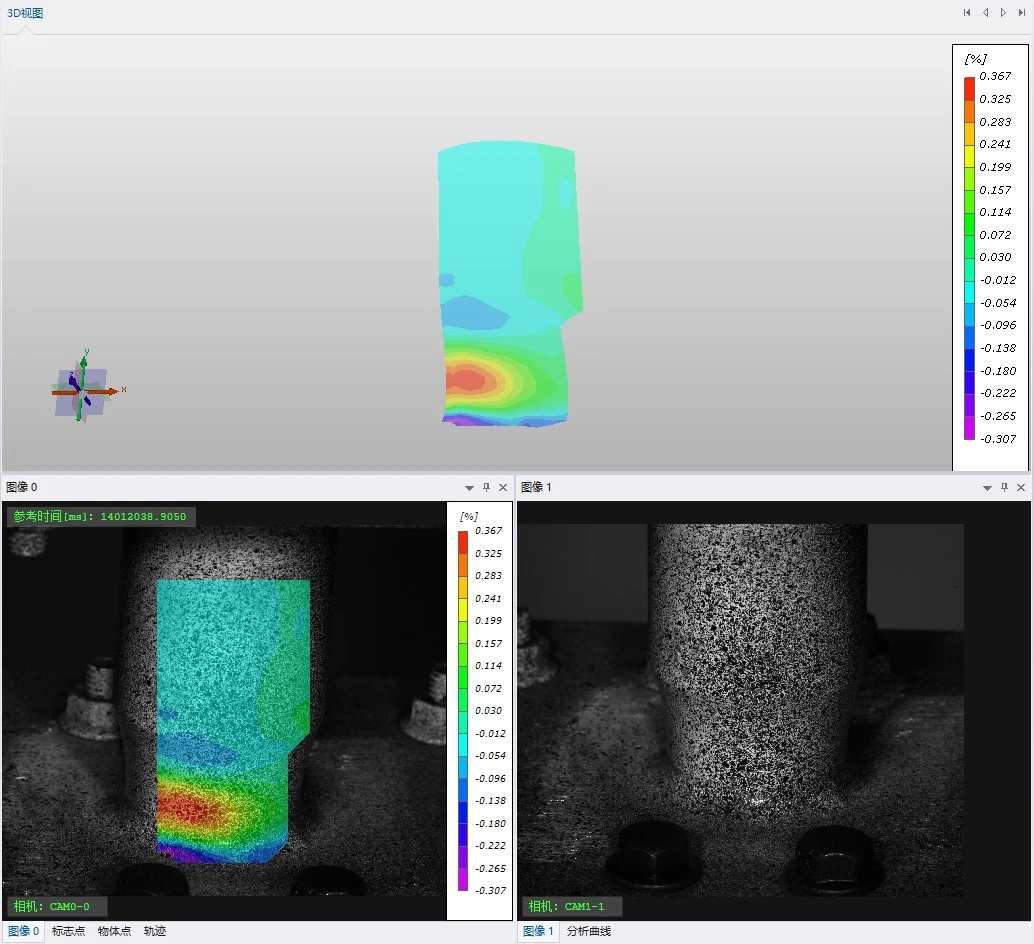
Shear strain contour map of a welded cylindrical specimen
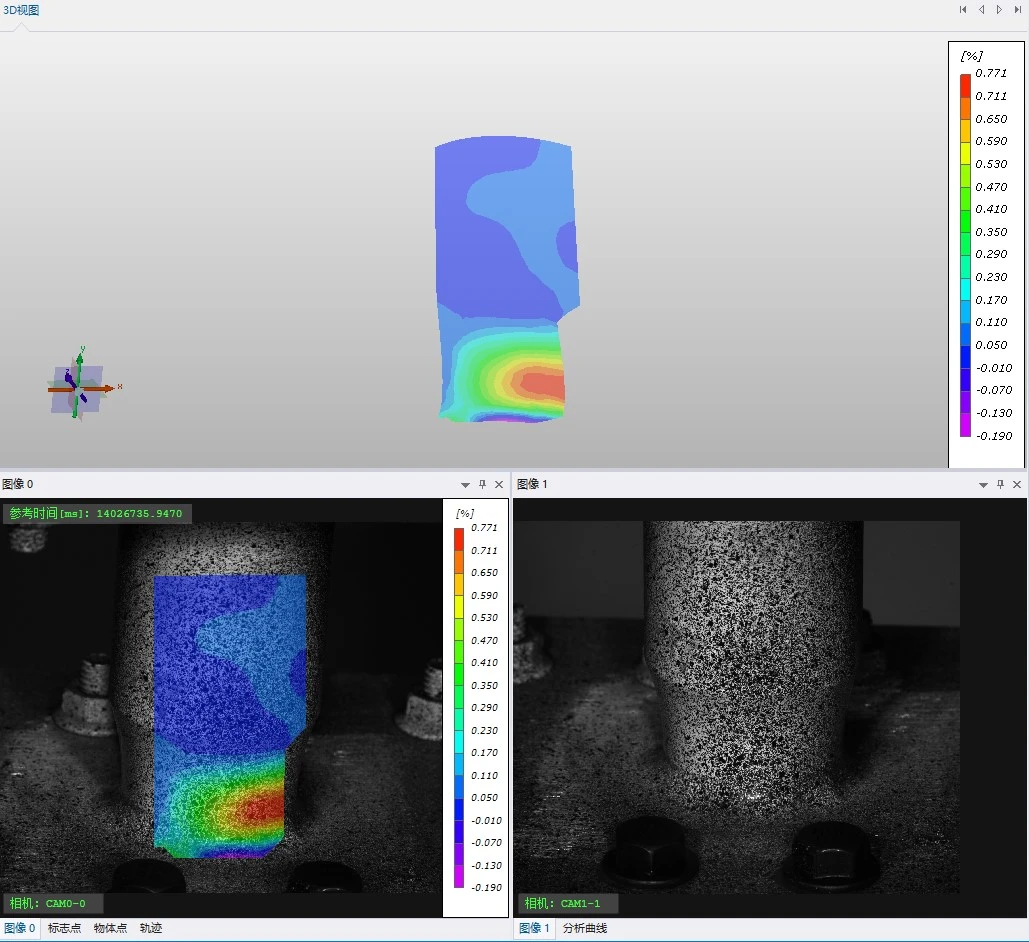
Axial strain contour map
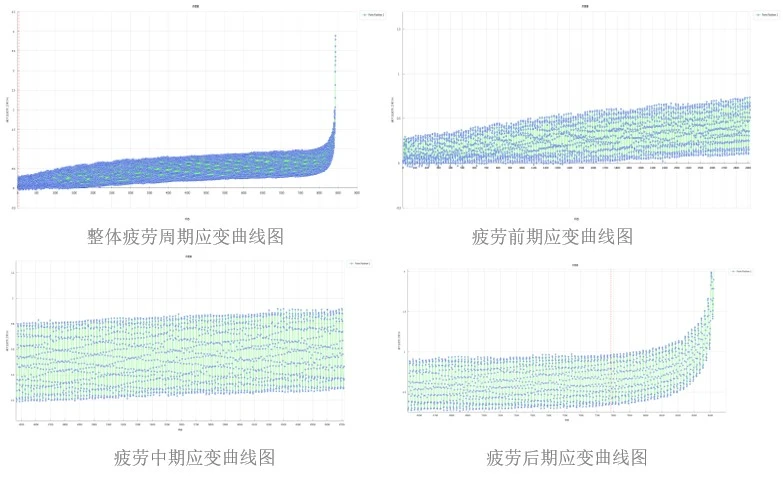
V. Analysis of Test Results
1. Displacement asymmetry: Displacement data from the left and right sides of the specimen indicate a stiffness mismatch in the welded zone.
2. High shear strain zones (indicated in red) are distributed in a band-like pattern along the weld fusion line and progressively expand during cyclic loading.
3. Protective effect of the ground area: Axial strain is lower in the ground area, demonstrating that surface treatment effectively reduces stress concentration.
4. Weld profile optimization: Significant strain concentration occurs at the fusion line; a gradual transition design (such as increasing the fillet radius) is recommended to redistribute stress.
5. Multiaxial fatigue assessment: Axial strain dominates the damage process, yet localized spikes in shear strain cannot be overlooked; the test data facilitate the analysis of combined loading characteristics.