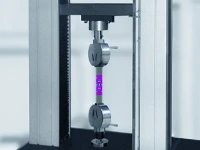
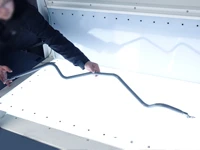
Automotive audio systems rely heavily on acoustic components—specifically speaker diaphragms and molding tools—to deliver a quality driving experience. As precision, thin-walled components with complex curved geometries, their surface profile accuracy, global thickness uniformity, and molding precision directly determine vibration frequency and sound balance. Localized thickness deviations, machining deformations, or long-term wear in the molds can lead to defects such as unwanted noise, tonal distortion, and imbalances between high and low frequencies, severely impacting product yield and the end-user experience.
While traditional inspection methods excel in single-point measurement accuracy and data reliability—serving as the standard for industrial dimensional verification—they are limited to capturing discrete data points. They cannot fully capture the workpiece's 3D topography or quantify global surface deformation and thickness distribution. Consequently, defect root-cause analysis and mold rectification rely heavily on manual expertise, resulting in lengthy trial cycles and high costs associated with managing defective products.
To meet the industry's critical need for full-dimensional quality control, blue-light 3D scanning technology complements contact-based single-point inspection. By leveraging full-field scanning capabilities to overcome the limitations of single-point measurement, it has become an essential solution for the digital, full-surface quality control of automotive acoustic components.
I. Core Limitations of Traditional Inspection Methods
Traditional inspection methods rely on standard dimensional metrology tools, primarily used for the precise verification of critical feature points. However, when applied to complex, thin-walled, free-form components—such as audio diaphragms and speaker molds—they suffer from unavoidable drawbacks:
1. Lack of Full-Field Topography Data
They cannot fully map the entire surface; consequently, issues such as gradual thickness variations, slight warping, or mold cavity wear across large areas are easily overlooked, making it impossible to diagnose the root causes of inconsistent sound quality across batches of speakers.
2. Risk of Damage to Thin-Walled Components
Audio diaphragms are thin and made of soft materials, while mold cavities feature high-precision polished surfaces. Contact-based data acquisition carries a high risk of scratching or denting the workpiece, rendering these methods unsuitable for non-destructive, 100% inspection of finished products.
3. Low Efficiency for Complex Surface Measurement
Both diaphragms and speaker molds feature free-form surfaces. Inspecting a single component is time-consuming, making these methods incompatible with the high-efficiency sampling and quality control requirements of production lines.
4. Inability to Visually Map Defect Distribution
They cannot generate full-field deviation maps (heat maps) to intuitively display the extent and gradient of deformation or wear, leaving mold repairs and process adjustments without clear, data-driven references.
5. Lack of Support for Assembly Analysis
They only output discrete dimensional values rather than creating a complete 3D digital model. This prevents the pre-analysis of mating gaps or assembly interferences, resulting in high costs associated with trial-and-error processes.
6. Difficulty in Monitoring Wear
Discrete data points make it difficult to track full-field wear changes over the long term or to quantify the overall deformation trends of the mold cavity.
Contact-based equipment performs precise verification of critical datum holes, key assembly dimensions, and high-precision point-specific tolerances, generating legally traceable metrology data for individual points; blue-light 3D scanning technology handles comprehensive, multi-dimensional inspection of full-surface contours, complete profiles, area-wide thickness distribution, and overall deformation. Together, they form a combined quality inspection model that balances inspection efficiency and full-coverage capability with the authoritative nature of point-specific metrology.
II. Full-Scale Inspection Solution Using Blue-Light 3D Scanning
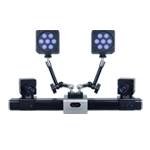
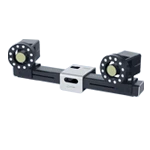
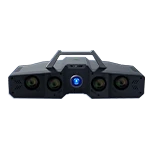
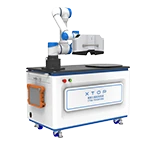
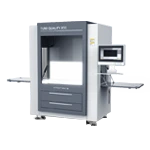
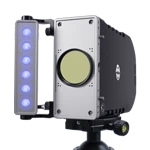
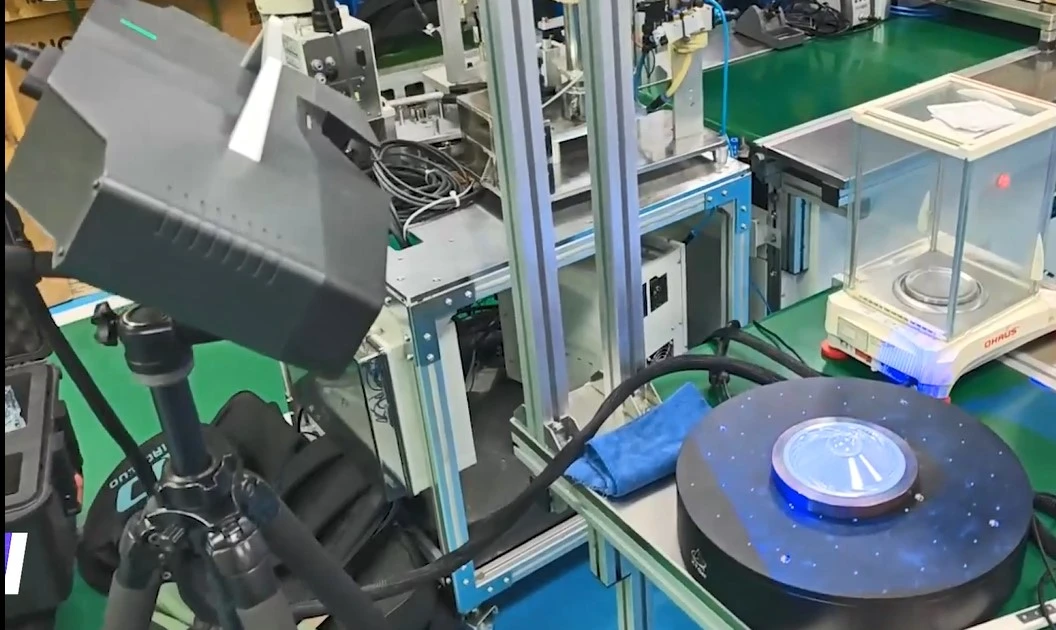
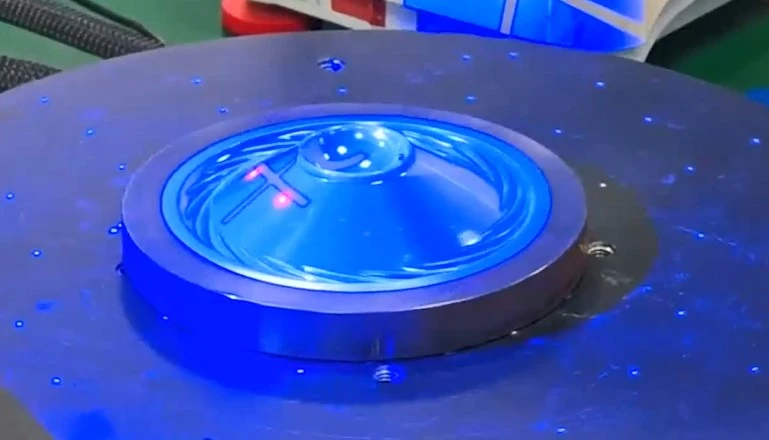
This solution utilizes the XTOP3D XTOM blue-light 3D scanner, global point cloud stitching technology, and X-INSPECT 3D inspection and analysis software to establish an integrated inspection workflow: workpiece pre-treatment → multi-view 3D scanning → automatic point cloud stitching → CAD model alignment → full-field deviation color mapping → cross-sectional thickness inspection → standardized inspection report generation.
The XTOM blue-light 3D scanner employs non-contact blue-light technology suitable for thin-walled, scratch-prone audio diaphragms and precision mold cavities. It accurately captures minute deformations and thickness variations, making it ideal for applications ranging from the inspection of finished audio diaphragms to the analysis of speaker molding dies.
Case Study 1: 3D Inspection of Automotive Speaker Diaphragms
1. 3D Scanning Inspection Data
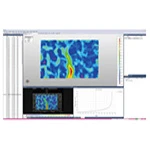
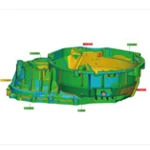
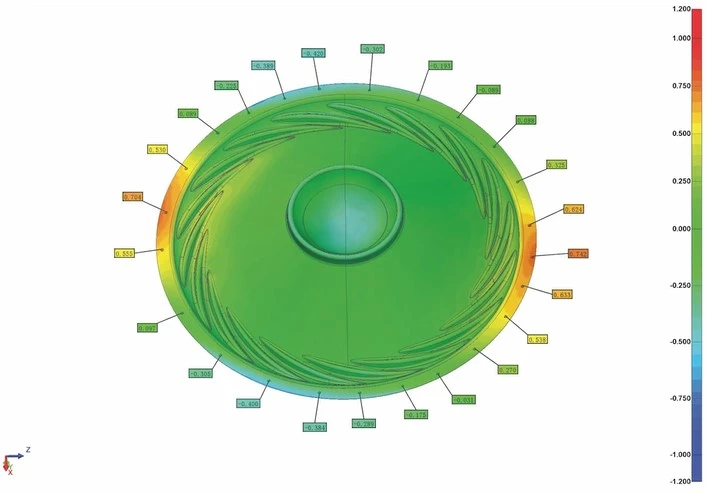
Global surface deviation map: The overall error range is -1.200 mm to +1.000 mm, with deviations across the vast majority of the diaphragm's active acoustic surface controlled within the ±0.25 mm range; the equipment is capable of capturing subtle thickness fluctuations.
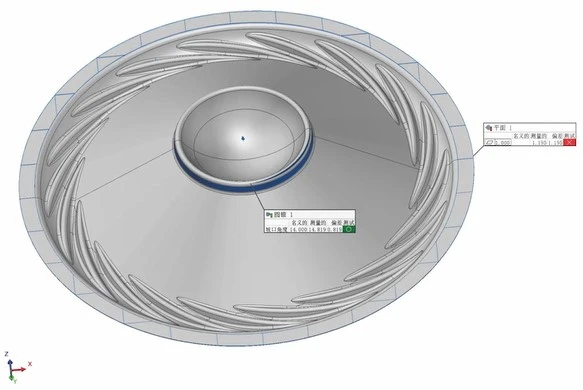
2) Measured cross-sectional thickness data: Measured thickness values at multiple key cross-sectional points range from -1.191 mm to +0.028 mm, with a thickness variation of 1.1 mm; thickness deviations in several areas exceed the tolerance limits specified in the engineering drawings.
3) Virtual assembly clearance data: Simulation involving the alignment of the complete 3D model with the speaker base CAD model reveals local mating clearance discrepancies exceeding 0.3 mm, indicating a risk of poor assembly fit.
2. Inspection Result Analysis
The diaphragm exhibits uneven global thickness distribution, with local areas exceeding thickness tolerances; surface deformation—caused by injection molding shrinkage and pressure fluctuations—leads to inconsistent vibration amplitudes, which are direct causes of audio distortion and unwanted noise.
Assembly clearance data indicates local mating discrepancies between the diaphragm and the base, posing quality risks such as loose assembly and resonance-induced noise during mass production.
Case Study 2: 3D Inspection of Speaker Mold Cavity
1. 3D Scanning and Inspection Data
Full-surface mold deviation (color map): The overall error range is -1.400 mm to +1.000 mm, while the standard tolerance requirement for the molding surface is ±0.4 mm;
Cavity cross-section wear data: Wear on the production molding surface ranges from 0.45 mm to 0.82 mm; wear is most severe in the center of the cavity and at the parting line, with a maximum local wear deviation of 1.19 mm;
3) Longitudinal comparison data: By comparing the scanned model with the original CAD data, the full-surface wear gradient of the cavity across different production cycles can be quantified, clearly distinguishing between initial CNC machining errors and deformation caused by long-term mass production wear.
2. Assessment of Inspection Results
1) Local wear in the mold cavity exceeds molding tolerance standards, causing a shift in the cavity's baseline thickness; this results in thickness deviations in the molded parts, leading to batch acoustic defects;
2) Wear is distributed regionally and is non-uniform; localized grinding alone cannot fully resolve the molding thickness deviation issue, and indiscriminate mold modification would significantly increase the number of trial molding runs required.
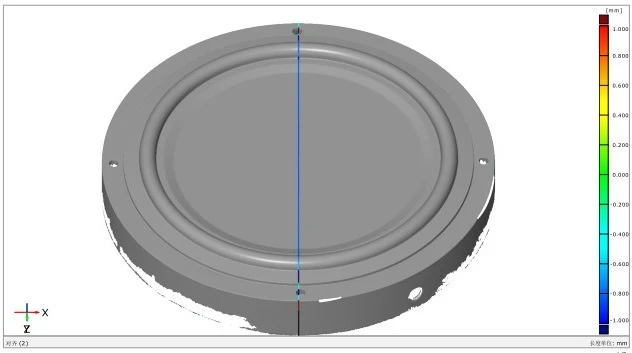
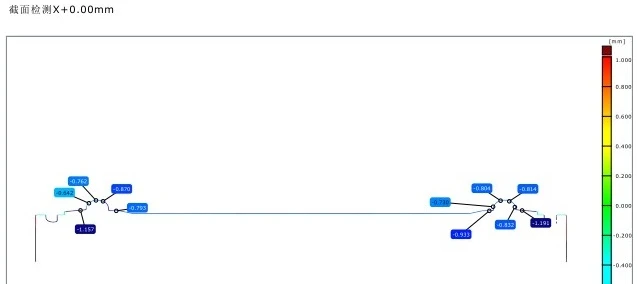
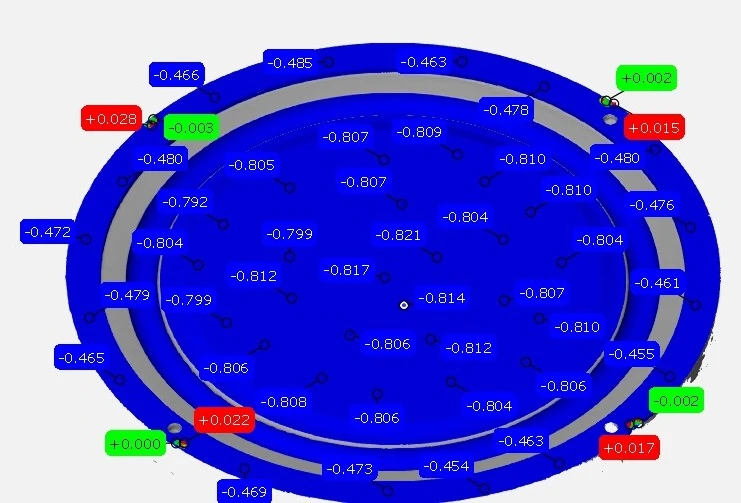
Cross-section line and virtual assembly fit check
III. Solution Summary
Precision thin-walled, curved components—specifically automotive audio diaphragms and speaker molds—are critical parts that determine the acoustic quality of the entire vehicle. Traditional inspection methods struggle to achieve comprehensive quality control across the entire surface of these workpieces; used in isolation, they fail to detect hidden quality issues such as uneven wall thickness or large-scale deformation.
The XTOM blue-light 3D scanner enables efficient, quantitative inspection of deviations across the entire surface of finished diaphragms and speaker mold cavities. It rapidly pinpoints surface defects and facilitates the optimization of injection molding and mold machining processes. This solution addresses key industry pain points—including uneven diaphragm thickness, audio distortion, the difficulty of quantifying mold wear, and high costs associated with mold repair and testing—by providing automotive acoustic component manufacturers with a 3D digital quality control solution that balances efficiency, full-surface coverage, and metrological reliability.